Transfer Plot
Once the dependencies and DXT Explorer have been installed:
dxt-explorer -t DARSHAN_FILE_COLLECTED_WITH_DXT_ENABLE.darshan
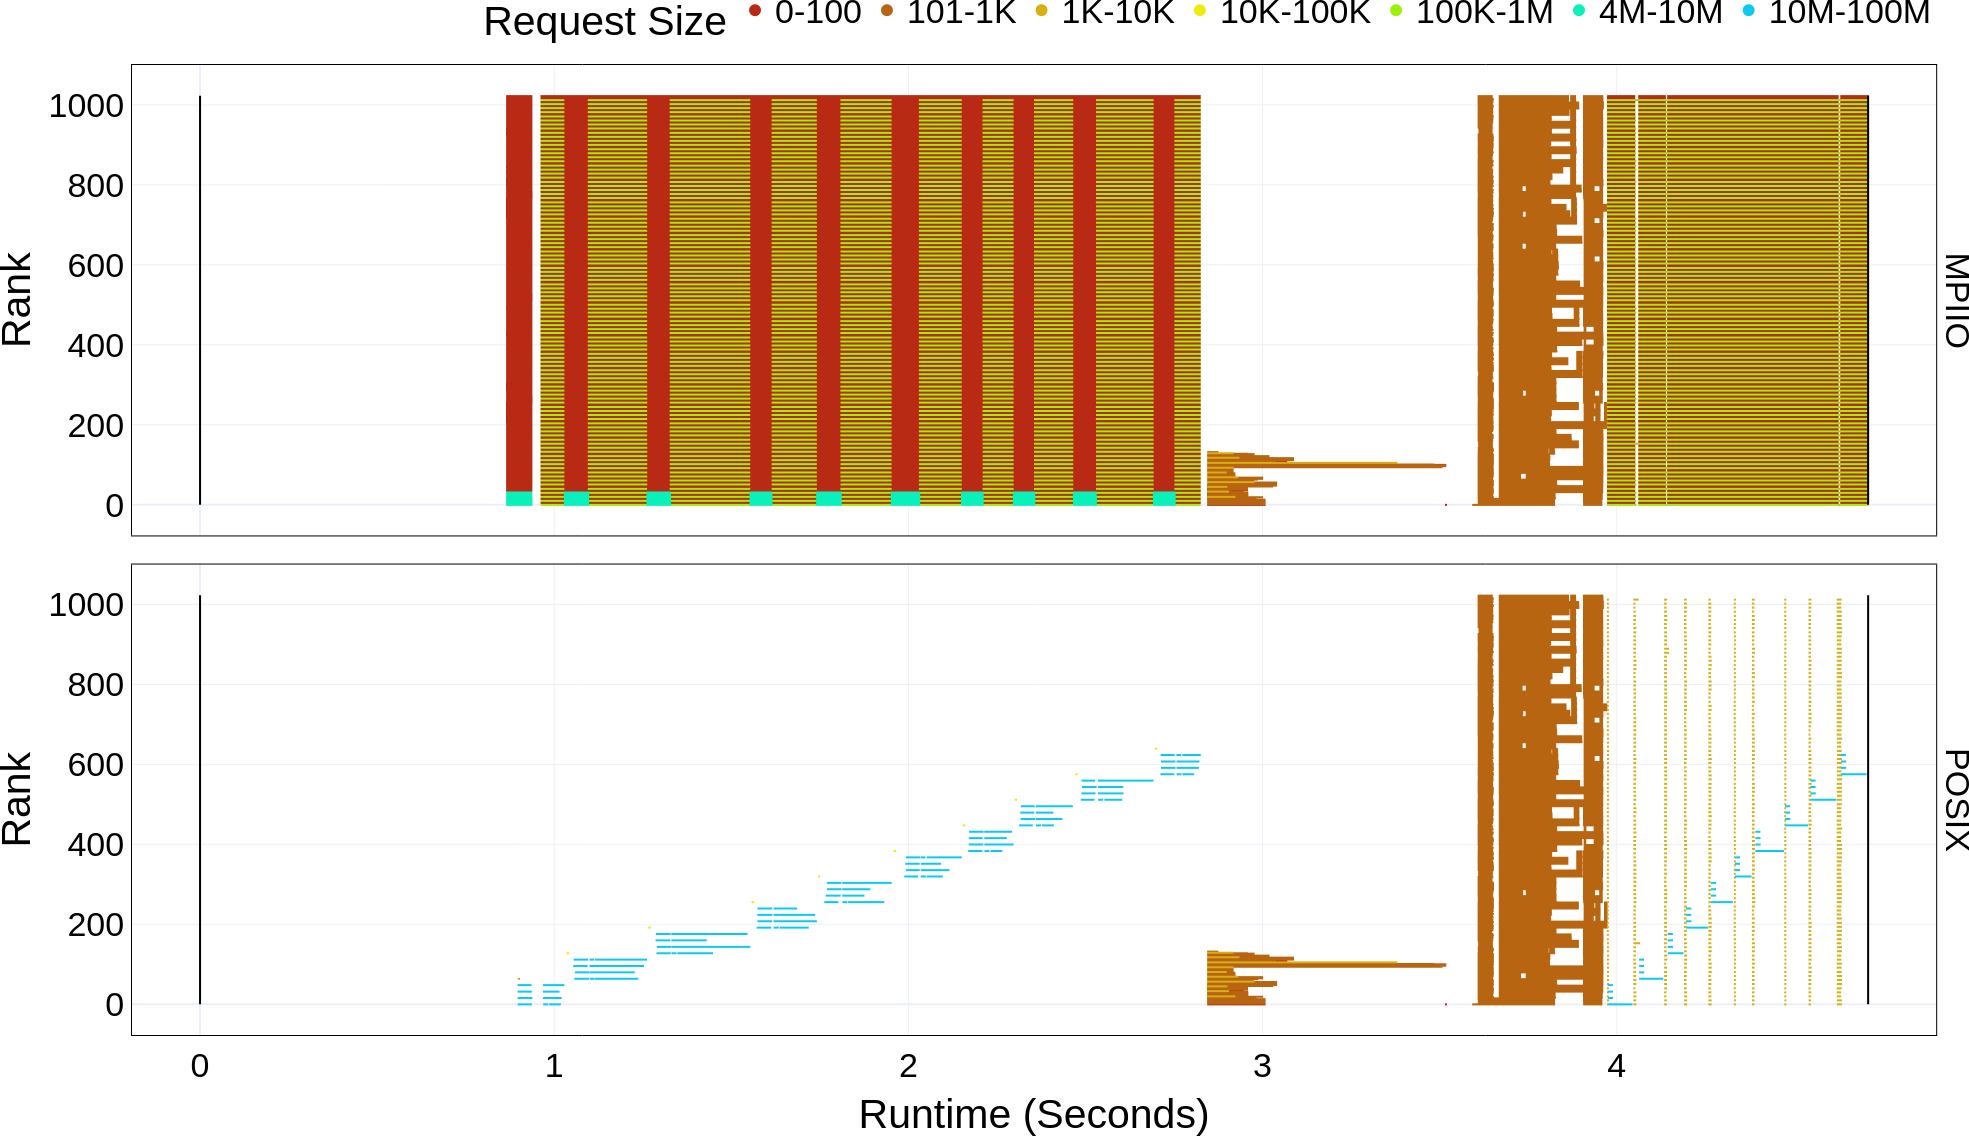
This will generate the transfer.html plot. The transfer.html plot shows the amount of data transferred by read and write requests of each rank throughout the runtime of the application. The request sizes are coloured in the plot based on the bin sizes used in Darshan, but the absolute value, if available, can be seen by hovering over a request. Contextual information link Rank, Operation, Duration, Size, Offset, Lustre OST can also be seen by hovering over a request.
This is the expected console output when calling DXT Explorer:
2022-11-02 12:58:22,979 dxt - INFO - FILE: <Filename> (ID <File ID>)
2022-11-02 12:58:22,979 dxt - INFO - generating dataframes
2022-11-02 12:58:26,681 dxt - INFO - generating interactive transfer for: <Filename>
2022-11-02 12:58:30,826 dxt - INFO - SUCCESS: <Path to the newly created transfer.html>
2022-11-02 12:58:30,834 dxt - INFO - SUCCESS: <Path to the newly created index.html>
2022-11-02 12:58:30,834 dxt - INFO - You can open the index.html file in your browser to interactively explore all plots
Interactive examples of DXT traces collected from FLASH, E2E, and OpenPMD are available in the companion repository of our PDSW’21 paper.