I/O Phase Plot
Once the dependencies and DXT Explorer have been installed:
dxt-explorer -i DARSHAN_FILE_COLLECTED_WITH_DXT_ENABLE.darshan
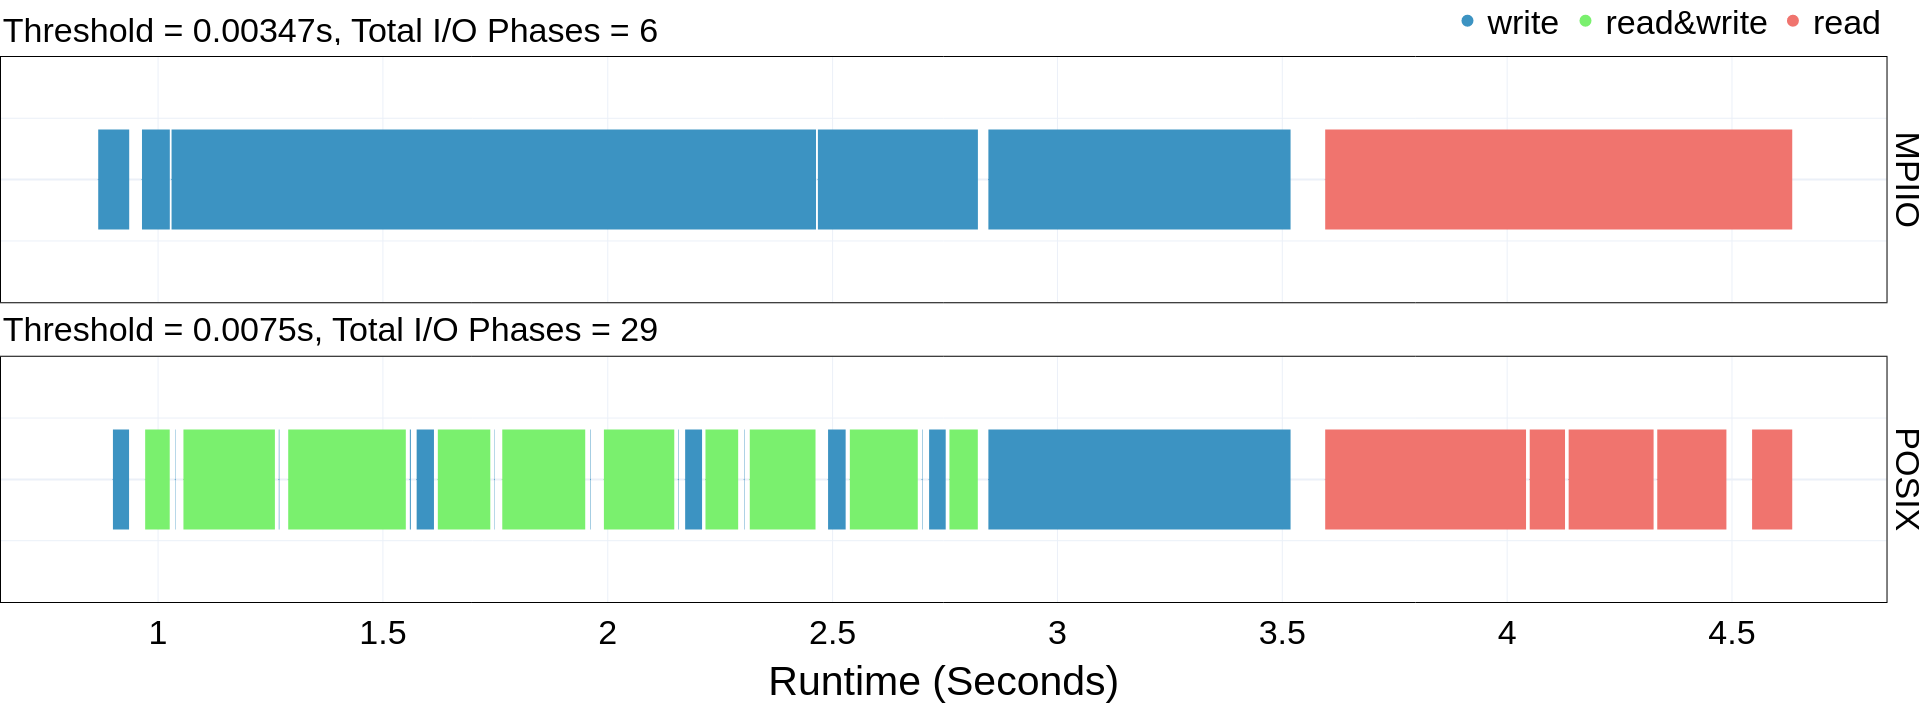
This will generate the base io-phase.html plot. The io-phase.html plot shows the different I/O Phases in the data. The plot also shows information regarding the number of I/O phases in each interface (MPIIO and POSIX) and the threshold value used to merge the phases. The threshold value is computed by summing the mean and standard deviation of all the intervals between the I/O phases. Contextual information link Fastest Rank, Fastest Rank Duration, Slowest Rank, Slowest Rank Duration can also be seen by hovering over a phase.
This is the expected console output when calling DXT Explorer:
2022-11-02 12:58:22,979 dxt - INFO - FILE: <Filename> (ID <File ID>)
2022-11-02 12:58:22,979 dxt - INFO - generating dataframes
2022-11-02 12:58:26,681 dxt - INFO - generating interactive I/O phase plot for: <Filename>
2022-11-02 12:58:30,826 dxt - INFO - SUCCESS: <Path to the newly created spatiality.html>
2022-11-02 12:58:30,834 dxt - INFO - SUCCESS: <Path to the newly created index.html>
2022-11-02 12:58:30,834 dxt - INFO - You can open the index.html file in your browser to interactively explore all plots