Exploring
Once the dependencies and DXT Explorer have been installed:
dxt-explorer DARSHAN_FILE_COLLECTED_WITH_DXT_ENABLE.darshan
usage: dxt-explorer [-h] [-o OUTPUT] [-p PREFIX] [-t] [-s] [-i] [-oo] [-ot] [-r] [-u] [-st] [-d] [-l] [--start START] [--end END] [--from START_RANK] [--to END_RANK] [--browser] [-csv] [-v] darshan

DXT Explorer:

positional arguments:
  darshan               Input .darshan file

optional arguments:
  -h, --help            show this help message and exit
  -o OUTPUT, --output OUTPUT
                        Output directory
  -p PREFIX, --prefix PREFIX
                        Output directory
  -t, --transfer        Generate an interactive data transfer explorer
  -s, --spatiality      Generate an interactive spatiality explorer
  -i, --io_phase        Generate an interactive I/O phase explorer
  -oo, --ost_usage_operation
                        Generate an interactive OST usage operation explorer
  -ot, --ost_usage_transfer
                        Generate an interactive OST usage data transfer size explorer
  -r, --rank_zero_workload
                        Determine if rank 0 is doing more I/O than the rest of the workload
  -u, --unbalanced_workload
                        Determine which ranks have unbalanced workload
  -st, --stragglers     Determine the 5 percent slowest operations in the time distribution
  -d, --debug           Enable debug mode
  -l, --list            List all the files with trace
  --start START         Report starts from X seconds (e.g., 3.7) from beginning of the job
  --end END             Report ends at X seconds (e.g., 3.9) from beginning of the job
  --from START_RANK     Report start from rank N
  --to END_RANK         Report up to rank M
  --browser             Open the browser with the generated plot
  -csv, --csv           Save the parsed DXT trace data into a csv
  -v, --version         show program's version number and exit
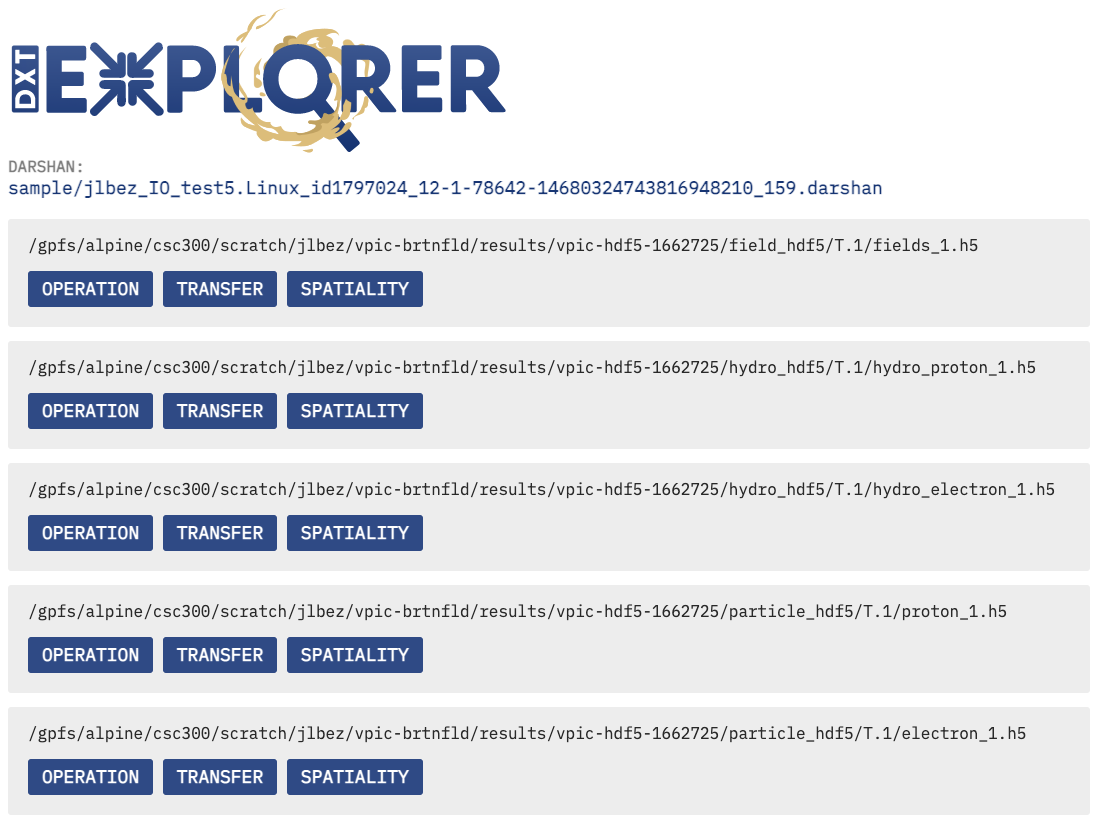
DXT Explorer will generate by default an index.html file with links to all interactive plots that can be opened in any browser to explore. If the transfer or spatiality plots were enabled, additional .html files will be generated, one for each type and the link to those html files will be provided in the index.html file.
This is the expected console output when calling DXT Explorer:
2022-11-02 12:58:22,979 dxt - INFO - FILE: <Filename> (ID <File ID>)
2022-11-02 12:58:22,979 dxt - INFO - generating dataframes
2022-11-02 12:58:26,681 dxt - INFO - generating interactive operation for: <Filename>
2022-11-02 12:58:30,826 dxt - INFO - SUCCESS: <Path to the newly created Operation.html>
2022-11-02 12:58:30,834 dxt - INFO - SUCCESS: <Path to the newly created Index.html>
2022-11-02 12:58:30,834 dxt - INFO - You can open the index.html file in your browser to interactively explore all plots
Interactive examples of DXT traces collected from FLASH, E2E, and OpenPMD are available in the companion repository of our PDSW’21 paper.